User-Driven Reporting & Analytics for ERP & Other Systems
Thousands of ERP users worldwide rely on the Stratum data management and reporting platform by Silvon to drive accurate insights from their data – often together with Power BI and other reporting apps.
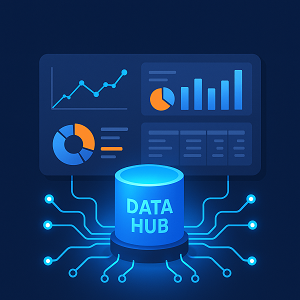
Built-In Data Hub Offers Easy Integration with ERP, Other Data Sources
- Easily integrates data from regular and custom ERP tables, other ERPs and sources into a single, unified version of truth.
- Optimizes the data for analytics with built-in tools for organizing, aligning, and updating it.
- Doesn’t require users to know how the data is organized.
- There’s absolutely no drain on system performance since queries aren’t run directly against your ERP system.
User-Driven ERP Reporting with Lots of Perks
- Intuitive to use and requires no understanding of ERP tables or structures.
- Comes with pre-built integration into ERP.
- Includes hundreds of pre-built dashboards, reports, and KPIs for enterprise performance analysis.
- Live, drillable dashboards and links can be embedded into ERP and other apps (e.g., CRM).
- Offers multiple ways to adjust and view data in terms of time (e.g., season-based time ranges).
- Provides pre-defined, advanced calculations.
- Lets users integrate and explore other data in context with ERP data – like budgets, forecasts, market demographics, weather trends.
- Offers automated email alerts and report distribution.
- Provides seamless integration with Excel and Power BI for additional data exploration and visualization.
What’s in it for Power BI Users?
- ERP Power BI users don’t need to be Stratum experts. A pre-built data model with defined dimensions and measures is available to them out of the box.
- They don’t need to understand ERP tables and joins either. Stratum takes care of it all for them.
- Users simply connect to Stratum’s Data Hub and pick from pre-existing reports to fuel their dashboards and charts.
- Plus, they can move seamlessly between Power BI and Stratum to view more granular levels of detail.
- The end result? Better fact-based decisions from tools you already use today together with Silvon’s popular data management platform.
Brought To You By the Most Experienced Business Intelligence Solution Provider for ERP
- Silvon has served ERP users for 30+ years.
- Our product experts bring many years of manufacturing experience to the table, too.
- All training and support is provided by Silvon’s product specialists.
- If desired, Silvon can host and manage Stratum in a very cost-effective way for you, too.
A Low-Risk Way to Get Started!
- Have a conversation with our experts and receive a demonstration that aligns with your most critical business needs. Then, if you’d like to test things out using a small subset of your own data, we’d be happy to put together a Proof of Concept trial for you. At the conclusion of the trial, you will be in the best position to make an informed decision while having a solution in place that’s already producing key insights for your business.
Our Clients
More than 2000 companies rely on Silvon’s Business Intelligence solutions today.


Relevant Data Management & Reporting Articles
Why a Data Hub Is the Secret Weapon Behind Great Dashboards
 Data visualization tools like Power BI have transformed the way organizations explore and share data. With sleek dashboards and interactive reports, business users can turn numbers into narratives in just a few clicks. But here’s the catch — behind every beautiful …
What Today's Modern BI Systems Do That Legacy Reporting Tools Can’t
 Analytics and business intelligence (BI) are no longer optional—they’re essential. In today’s fast-moving business landscape, leaders need immediate, trustworthy insights to outpace competitors, spot trends before they escalate into problems, and seize opportunities as they …
6 KPIs That Influence Inventory Optimization
 Inventory is the lifeblood of any manufacturing business. Get it right, and you’ve got happy customers and streamlined costs. Get it wrong, and you risk financial strain and fulfillment headaches. Striking the perfect balance between available stock and cost …
Beyond the Dashboard: Data Management Struggles with Visualization Tools
 Power BI and similar visualization tools excel at providing quick access to business data, but they often fall short when it comes to data management and performance optimization. Even those with built-in data management features can be complex and difficult for …
The Power of a Data Hub for BI & Analytics
 In today’s data-driven business environment, organizations generate vast amounts of information from multiple sources. Managing and analyzing this data effectively is crucial for making informed decisions, improving efficiency, and gaining a competitive edge. This is where …
Integrating AI with BI - The Benefits & Data Challenges
 Business intelligence (BI) has become a cornerstone of enterprise decision-making. Whether delivered through centralized dashboards developed by IT and BI teams or via self-service applications, BI tools are now indispensable for business users. However, the integration of artificial …
Is Your Structured Data Ready for Analytics & Gen AI?
 In 2024, both analytics and generative AI (GenAI) adoption reached unprecedented levels. As businesses integrate these insight-generating technologies into daily operations, the spotlight shifts to what drives their success: data. But not just any data. Success depends on structured, …
How CPG Brands Can Harness the Power of POS Data
 For Greater Product Performance Visibility
and Improved Sales & Demand Planning
Consumer Packaged Goods (CPG) manufacturers operate in an increasingly competitive environment, where the ability to access and analyze timely, accurate data can make or break a company’s …
For Greater Product Performance Visibility
and Improved Sales & Demand Planning
Consumer Packaged Goods (CPG) manufacturers operate in an increasingly competitive environment, where the ability to access and analyze timely, accurate data can make or break a company’s …
Is Your Data Ready for AI and Analytics?
 A recent Deloitte survey found that 51% of CEOs consider data challenges the primary obstacle to generating business value with analytics and Artificial Intelligence (AI).
Clean, accurate and reliable data is essential to turning AI and analytics into powerful assets that …
A recent Deloitte survey found that 51% of CEOs consider data challenges the primary obstacle to generating business value with analytics and Artificial Intelligence (AI).
Clean, accurate and reliable data is essential to turning AI and analytics into powerful assets that …
A Strategic 8-Step Approach to Successful Business Intelligence Deployments
 Management's ability to consistently make timely and accurate business decisions—at both strategic and operational levels—is extremely influential in determining whether the company surpasses, or gets surpassed by, competitors. Yet for too many business executives, decision making is often …
20 Essential Financial & Operational KPIs for Manufacturing Businesses
 Performance tracking using metrics and KPIs can often be perplexing for many organizations. KPIs generally track longer-term company goals and are typically more financial or strategic in nature, such as increasing revenue by a certain percentage within a specified …
Why a Modern BI Platform is Needed for Predictive Analytics
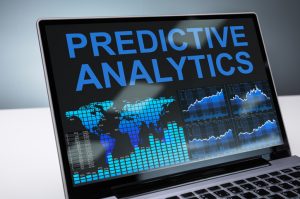 In an era where data is the new oil, businesses are constantly seeking innovative ways to extract valuable insights from their vast data reservoirs. Predictive Analytics has emerged as a pivotal tool in this quest, offering unprecedented foresight into market trends, …
How Manufacturers Can Leverage AI & Analytics For Strategic Decision-Making
 Across the globe, manufacturing businesses are navigating economic uncertainties with increasing sophistication. Critical to guiding them through today’s fluctuating markets is the accuracy and actionable intelligence derived from data. Insights gleaned from robust data …
The Advantages of Using Self-Service Business Intelligence (BI) Tools
In today's data-driven business environment where the volume of business data is constantly expanding, it's crucial for companies to emphasize effective data management and analysis through business intelligence (BI). BI tools are instrumental in enabling businesses to …
How To Move Your Business Data To a New ERP System In a Risk-Free Way
 Thinking about replacing your current ERP system with a new, on-premise or cloud-based solution? It's a significant endeavor, and it comes with its fair share of challenges. You have to deal with issues like time constraints, data quality, stakeholder support, potential …