User-Driven XA/MAPICS Reporting with Lots of Perks
- Intuitive to use and requires no understanding of Infor XA (MAPICS) tables or structures.
- Comes with pre-built integration into Infor XA (MAPICS).
- Includes hundreds of pre-built dashboards, reports, and KPIs for enterprise performance analysis.
- Live, drillable dashboards and links can be embedded into Infor XA (MAPICS) and other apps (e.g., CRM).
- Offers multiple ways to adjust and view data in terms of time (e.g., season-based time ranges).
- Provides pre-defined, advanced calculations.
- Lets users integrate and explore other data in context with Infor XA (MAPICS) data – like budgets, forecasts, market demographics, weather trends.
- Offers automated email alerts and report distribution.
- Provides seamless integration with Excel and Power BI for additional data exploration and visualization.
Built-In Data Hub Offers Easy Integration with Infor XA (MAPICS), Other Data Sources
- Easily integrates data from regular and custom Infor XA (MAPICS) tables, other ERPs and sources into a single, unified version of truth.
- Optimizes the data for analytics with built-in tools for organizing, aligning, and updating it.
- Doesn’t require users to know how the data is organized.
- There’s absolutely no drain on system performance since queries aren’t run directly against your Infor XA (MAPICS) system.
- Plus, Stratum’s data hub of historical information ensures that you’ll never have a gap in your trend reporting should you migrate to a new ERP in the future.
Brought To You By the Most Experienced Business Intelligence Solution Provider for XA/MAPICS
- Silvon has served Infor XA (MAPICS) users for 30+ years – longer than any other BI solution provider today.
- Our product experts bring many years of manufacturing experience to the table, too.
- All training and support is provided by Silvon’s product specialists.
- If desired, Silvon can host and manage Stratum in a very cost-effective way for you, too.
Our Clients
More than 2000 companies rely on Silvon’s Business Intelligence solutions today.


A Low-Risk Way to Get Started!
- Have a conversation with our experts and receive a demonstration that aligns with your most critical business needs.
Relevant Data Management & Reporting Articles
Augmented Analytics: Where AI and Business Analytics Deliver Better Decisions Together
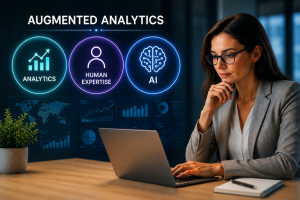 As organizations race to adopt AI, many are discovering that technology alone doesn't create better business decisions. As a matter of fact, many enterprise AI initiatives are falling short of expectations because while AI can speed up data analysis, executives lack …
Why AI is Not a Replacement for BI
 For the past few years, the business technology world has been captivated by a single question:
Will (or has) AI replaced Business Intelligence?
With the rise of generative AI, conversational analytics, and autonomous agents, it's easy to understand why some people believe traditional …
For the past few years, the business technology world has been captivated by a single question:
Will (or has) AI replaced Business Intelligence?
With the rise of generative AI, conversational analytics, and autonomous agents, it's easy to understand why some people believe traditional …
Manufacturing Analytics: 4 Things Successful Businesses Do
 Today’s most important manufacturing analytics center on transforming production, maintenance, quality, supply chain, workforce, and planning data into connected systems that improve operational decision-making.
Manufacturing analytics is no longer …
Today’s most important manufacturing analytics center on transforming production, maintenance, quality, supply chain, workforce, and planning data into connected systems that improve operational decision-making.
Manufacturing analytics is no longer …
AI Is Only as Smart as Your Data ...
Why Trusted Intelligence Starts with Data Readiness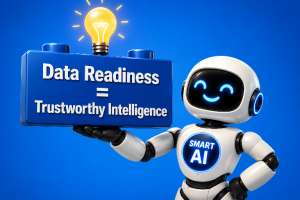 Artificial intelligence is rapidly reshaping how businesses analyze information, make decisions, and operate. Executives are being promised a future filled with predictive insights, automated recommendations, …
Why Unified Data Architectures Are Essential for AI Success
 Artificial Intelligence is everywhere right now — in boardroom conversations, technology roadmaps, and budget reallocations. Organizations are racing to fund AI initiatives, launch pilots, and demonstrate “intelligent” capabilities.
But here’s the reality many leaders are …
Artificial Intelligence is everywhere right now — in boardroom conversations, technology roadmaps, and budget reallocations. Organizations are racing to fund AI initiatives, launch pilots, and demonstrate “intelligent” capabilities.
But here’s the reality many leaders are …
Boosting Supply Chain Performance with Unified Data
 In today’s global economy, supply chains generate enormous volumes of data across procurement, production, logistics, distribution, and customer fulfillment. Yet for many organizations, the real challenge is not a lack of data — it is the inability to connect, trust, and act on that …
Modernizing Analytics and Reports Around Legacy ERP
A pragmatic roadmap for manufacturers and distributors to strengthen data trust, operational visibility, and AI readiness—without disrupting ERP performance Many manufacturers and distributors continue to …
Top Features To Look For in a Business Analytics & Reporting Solution
AN EXCLUSIVE GUIDE FOR MID-MARKET MANUFACTURERS For mid-market manufacturers, the need for clear, timely business insights is as critical as it is for Fortune 500 companies. Yet limited budgets, leaner teams, and shorter implementation windows often make choosing the right …
Why a Data Hub Is the Secret Weapon Behind Great Dashboards
 Data visualization tools like Power BI have transformed the way organizations explore and share data. With sleek dashboards and interactive reports, business users can turn numbers into narratives in just a few clicks. But here’s the catch — behind every beautiful …
What Today's Modern BI Systems Do That Legacy Reporting Tools Can’t
 Analytics and business intelligence (BI) are no longer optional—they’re essential. In today’s fast-moving business landscape, leaders need immediate, trustworthy insights to outpace competitors, spot trends before they escalate into problems, and seize opportunities as they …
6 KPIs That Influence Inventory Optimization
 Inventory is the lifeblood of any manufacturing business. Get it right, and you’ve got happy customers and streamlined costs. Get it wrong, and you risk financial strain and fulfillment headaches. Striking the perfect balance between available stock and cost …
Beyond the Dashboard: Data Management Struggles with Visualization Tools
 Power BI and similar visualization tools excel at providing quick access to business data, but they often fall short when it comes to data management and performance optimization. Even those with built-in data management features can be complex and difficult for …
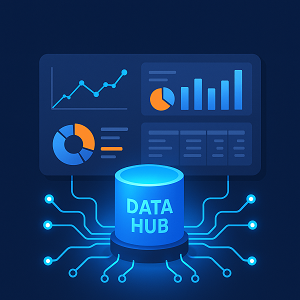
The Power of a Data Hub for BI & Analytics
 In today’s data-driven business environment, organizations generate vast amounts of information from multiple sources. Managing and analyzing this data effectively is crucial for making informed decisions, improving efficiency, and gaining a competitive edge. This is where …
Integrating AI with BI - The Benefits & Data Challenges
 Business intelligence (BI) has become a cornerstone of enterprise decision-making. Whether delivered through centralized dashboards developed by IT and BI teams or via self-service applications, BI tools are now indispensable for business users. However, the integration of artificial …
Is Your Structured Data Ready for Analytics & Gen AI?
 This year, both analytics and generative AI (GenAI) adoption reached unprecedented levels. As businesses integrate these insight-generating technologies into daily operations, the spotlight shifts to what drives their success: data. But not just any data. Success depends on …
- HOME
- Intro to Silvon and Stratum
- Stratum Data Hub & Analytics
- Data Hub
- Packaged BI
- Planning & Forecasting
- Resources
- Services & Support
- Customer Education