CEO Goal
Improve gross margin
Department Goals
Increase profitability
Finance
Increase profitability
Finance KPI
Gross Profit Margin
Sales
Optimize discounting
Sales KPI
Discount Rate
Operations
Reduce production cost
Operations KPI
Scrap / Waste %
What are KPIs in manufacturing?
“KPIs are measurable values that show how well you're achieving operational goals. In manufacturing, they keep production, inventory, and teams aligned.”
What are the most important KPIs for manufacturers to track?
Here are 10 essential manufacturing KPIs, organized by operational area:
- Production & Operations
- Overall Equipment Effectiveness (OEE)
Measures machine productivity by tracking availability, performance, and quality. - Cycle Time
Tracks the average time to produce one unit from start to finish.
- Overall Equipment Effectiveness (OEE)
- Yield Rate
Indicates the percentage of products produced without defects. - Inventory Management
- Inventory Turnover
Shows how often inventory is sold and replaced over a period. - Days on Hand (DOH)
Tracks how long, on average, inventory sits before being sold or used. - Reorder Point
The stock level at which new inventory needs to be ordered to avoid stockouts.
- Inventory Turnover
- Sales & Customer Service
- On-Time Delivery Rate
Measures the percentage of customer orders shipped on time. - Backorder Rate
Indicates how frequently products are unavailable at the time of order. - Demand Forecast Accuracy
Evaluates how close your forecasted demand was to actual sales.
- On-Time Delivery Rate
- Financial Performance
- Gross Profit Margin
Shows how much profit is generated from each dollar of revenue after accounting for the direct costs of production.
- Gross Profit Margin

What happens if manufacturers don’t track KPIs?
Without KPIs, manufacturers often face:
- Production bottlenecks
- High carrying costs from excess inventory
- Missed delivery deadlines
- Poor demand forecasting
- Lack of accountability across departments
KPIs bring clarity, alignment, and focus. They help leaders identify what’s working — and what needs fixing — in real time.
How should KPIs be visualized?
The most effective KPI tracking uses:
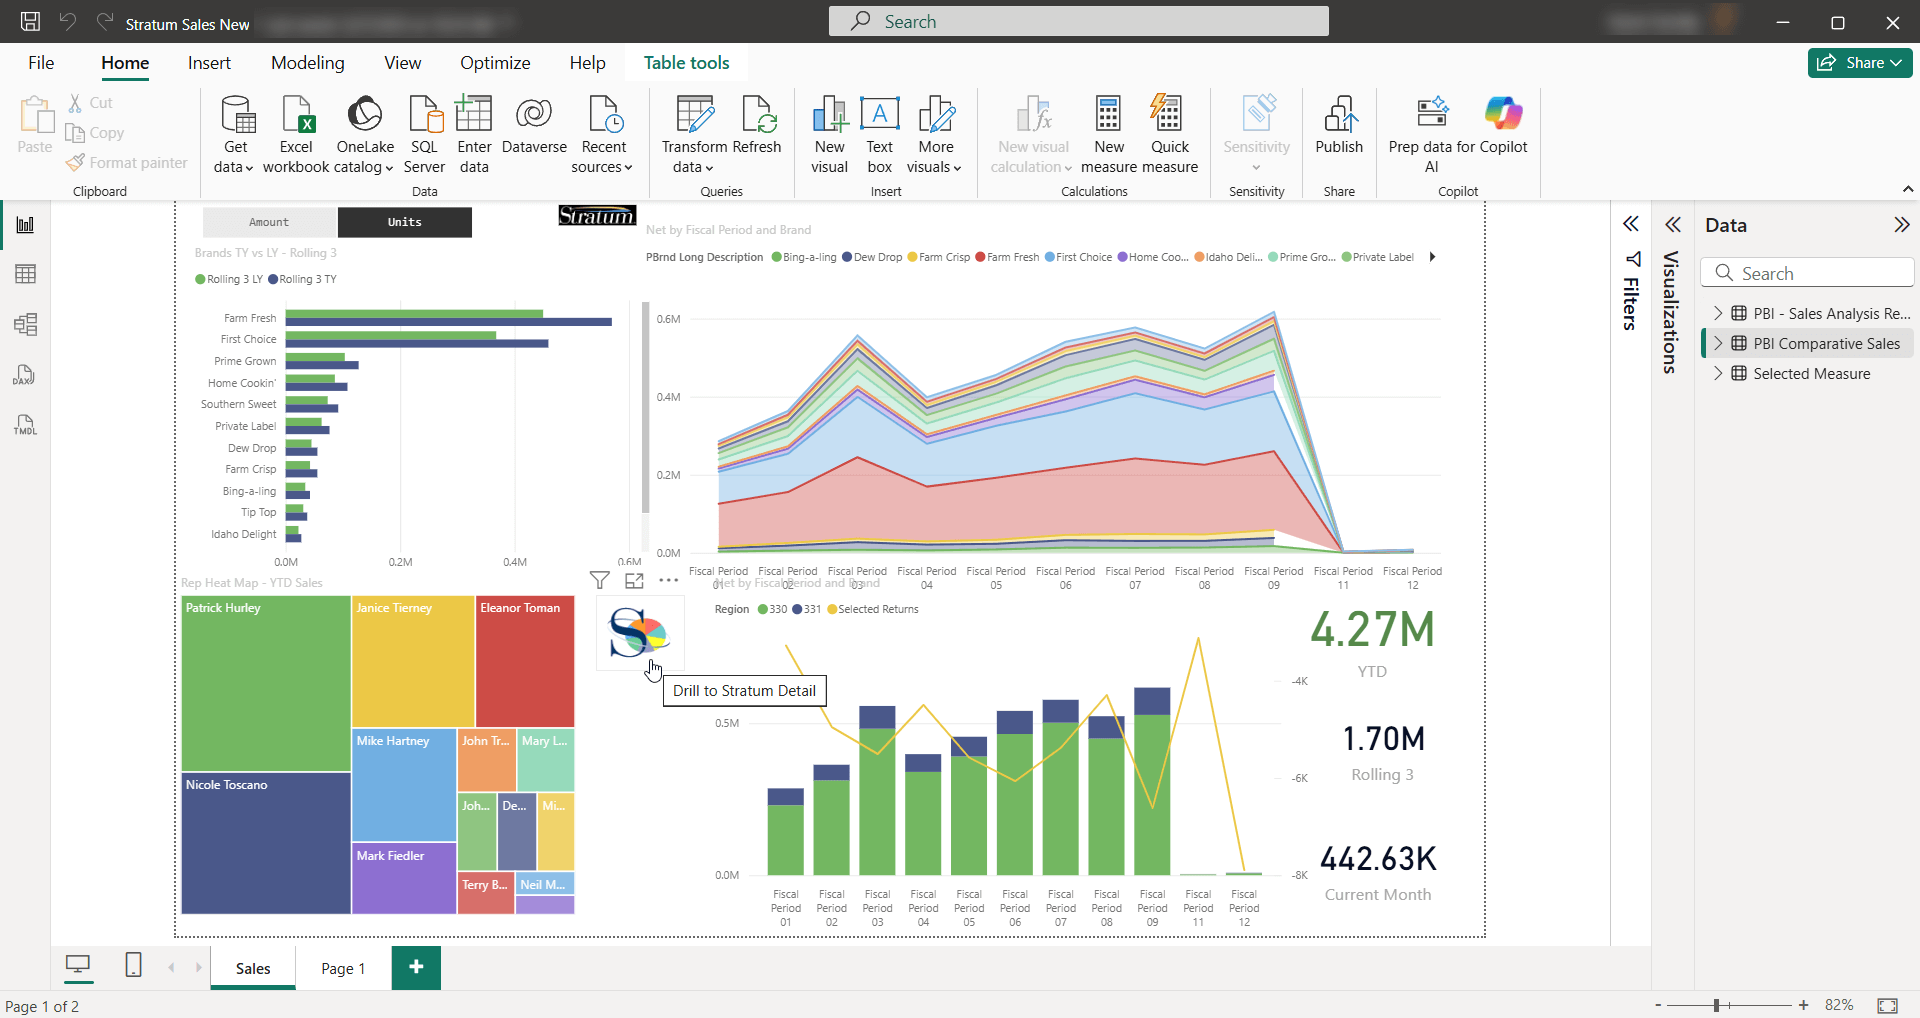
- Dashboards by department or role
- Historical trends and YOY comparisons
- Thresholds and alerts for exceptions
- Drill-downs from summarized to detailed views
Tools like Silvon Stratum allow manufacturers to automatically collect, analyze, and report on KPIs — without the manual effort of spreadsheets or generic BI tools.
How often should manufacturing KPIs be reviewed?
| Frequency | Use Case |
|---|---|
| Daily | Production KPIs like OEE, yield, downtime |
| Weekly | Inventory levels, cycle time, backorders |
| Monthly/Quarterly | Financial metrics, customer service KPIs, trends |
How can Silvon help with KPI tracking?
Silvon’s Stratum platform:
- Comes prebuilt with manufacturing-specific KPIs across sales, operations, finance, and more
- Integrates with your ERP and other systems
- Provides role-based dashboards, alerts, and exception reporting
- Supports KPI cascading so corporate goals align with departmental objectives
- HOME
- Intro to Silvon and Stratum
- Stratum Data Hub & Analytics
- Data Hub
- Packaged BI
- Planning & Forecasting
- Resources
- Services & Support
- Customer Education