How to Define a Performance Measurement Strategy
 While clearly important in today’s constantly changing business environment, so many companies continue to struggle with how to measure and improve their performance – grappling with questions like:
- Which metrics really matter?
- How do we get buy-in around the organization?
- Can we get the right resources needed to collect data for analysis before it’s too old?
- How can we overcome the resistance to systemic measurement?
What’s really needed, though, is a cohesive measurement strategy that identifies goals, defines a portfolio of metrics to achieve them, and outlines an implementation plan to make it part of your ongoing business process. This includes any change management activities that may be required and the technology that will be needed to make it repeatable.
A measurement strategy encompasses three simple steps to performance improvement:
Identify Your Measurement Goals
Define Your Metrics Hierarchy
Implement for Repeatability
Identify Your Measurement Goals
The first step is to clearly define your goals for measuring your business performance because different goals require very different metrics.
- Is your goal to have metrics that will help you analyze the root cause of problems in your business and apply the appropriate corrective action?
- Is your goal to provide a view into the financial health of your business?
- Is your goal to do scenario planning that will help guide ongoing decision-making? For example, the metrics that the CFO needs to get a good picture of the financial health of the supply chain business are quite different than the metrics the VP of supply chain needs to diagnose, correct, and manage supply chain operations. Each requires its own portfolio of metrics. It’s possible, even likely, that there will be overlap between the portfolios, but there are major differences as well. Even where the same metrics are used, there are differences. Consider the example of inventory:
-
- The CFO wants to see total inventory as a percentage of revenue.
- In contrast, the VP of supply chain wants to see inventory days or turns broken down into its components of raw material, work-in-process, and finished goods to pinpoint whether the source of problems is on the supplier, internal production, or customer side of the business.
Define Your Metrics Hierarchy
Because different goals require different metrics, the importance of clearly defining your goals for measuring performance cannot be understated. If your goal is to assess the financial health of the supply chain, for example, you’ll need different metrics than if your goal is to diagnose and correct supply chain issues. The outcome of identifying your goals becomes the input for defining the metrics needed to achieve those goals.
What’s needed is a metrics architecture made up of a network of metrics portfolios, providing a cohesive framework for managing each area of the business and tracking the interdependencies across them.
The Metrics Architecture
While everybody measures in most companies today, the metrics are typically either at too high or too low a level, and they’re disconnected from each other. Consider the following:
- The CFO knows earnings per share and EBIDTA.
- Sales knows revenue per salesperson.
- Customer service knows how long it takes to answer a call.
- Procurement knows how long it takes to process a purchase order.
- Supply chain knows on-time shipments.
- Manufacturing knows its first pass yield.
But what they can’t clearly see is the impact of each on the others. The only place all the metrics come together is in the financial statements, but by the time they get there, they’ve been rolled up, translated, and homogenized so many times they’re barely recognizable. Worse, at this point they cannot be used to truly manage the business.
You need an enterprise metrics architecture that defines the metrics that matter for the different areas of the business. Rather than trying to navigate and distill hundreds of possible metrics to understand how your supply chain is performing, you can hone in on the few metrics that give you the most comprehensive, end-to-end information, allowing you to quickly identify the levers you can use to improve supply chain operations.
A network of metrics hierarchies that cover each area of the business — supply, demand, product, finance, and such — allows a company to:
- Efficiently track and analyze each area of the business.
- Clearly see the interdependencies among the different areas of the business. In this way, the metrics architecture can be used not only for analysis of a historical or current situation, but also to do future-facing, what-if analysis and scenario planning.
Case example
Let’s look at a brief example of how a metrics architecture would work. Take the case of a company that creates a high-quality new product that meets customer needs. Marketing launches an initial promotional campaign successfully generates a spike in customer demand for the new product. However, marketing doesn’t communicate this to the supply chain organization. As a result, the company doesn’t have inventory to satisfy the heightened demand, resulting in stockouts and unhappy customers.
How would this situation be reflected in the metrics? We’ll use the graphic below to illustrate.
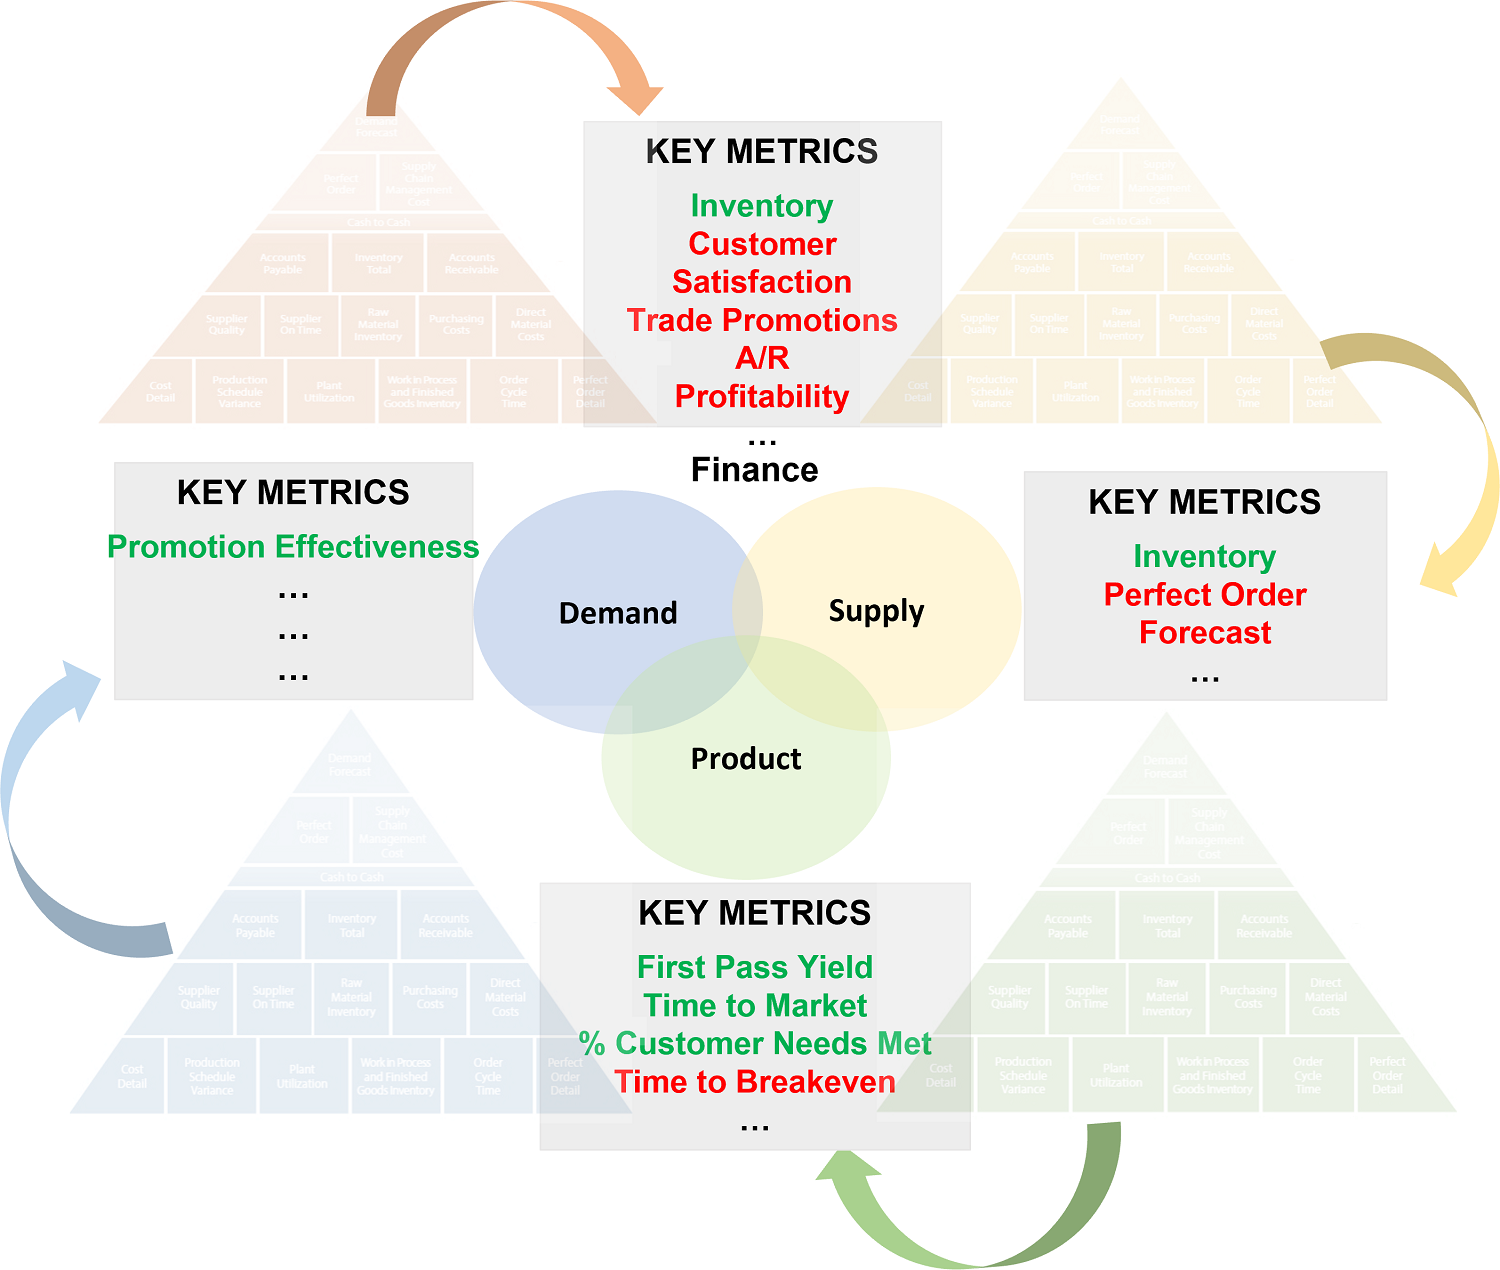
- Product— The Product metrics hierarchy on the bottom of the graphic would look great. As reflected in the first-pass yield numbers, product quality is good, incorporating a high proportion of customer needs, and time to market is short. One problem area that would show up here would be “time to breakeven,” which would be longer than anticipated due to the supply shortage.
- Demand—The Demand metrics hierarchy on the left side would also look good, and marketing would feel satisfied that its promotional campaign successfully shaped an increase in demand.
- Supply—The Supply metrics hierarchy on the right would not look so good The inventory days of supply would be great—that is, low—because they didn’t ramp up inventory, but everything else would be showing up “in the red.” Because they had no visibility into the expected increase in demand, they would show poor demand forecast accuracy, and a poor perfect order rating due to the high stockouts.
- Financial—How does this all flow into the Financial metrics hierarchy at the top? While inventory as a percentage of revenue would be low (which would make the CFO happy), other metrics would suffer: accounts receivable takes a hit, customer satisfaction is hurt due to unmet expectations, allowances and trade promotion adjustments have to be made, and profit
What a metrics architecture allows here is an objective analysis of what went wrong and, therefore, the ability to accurately fix the problem. Rather than everyone pointing the finger of blame at the supply chain organization, the use of a cohesive set of metrics hierarchies would allow a clearer picture to emerge, and thus an enhanced capability to continuously improve the business.
Implement for Repeatability
Any measurement of performance at this point would be a baseline set of metrics that can be used for comparative purposes, potentially as a benchmark against peer companies or even different divisions within the same company. But for your measurement strategy to come alive, it should be implemented in technology for repeatability. Only then will it become a real decision support system that will help guide your organization to increasingly better performance.
Fortunately, performance management applications like Silvon’s Stratum solution deliver the built-in data management tools, metrics and analytics needed to measure performance across the enterprise while setting the stage for performance improvement.
Taking the pulse of the business on an ongoing basis through the use of these applications allows you to make course corrections as early as possible to achieve ever-higher levels of performance.
From Performance Measurement to Performance Management
Keep in mind, though, that measurement alone won’t improve performance in the business; it requires an ongoing, repetitive cycle of performance measurement implemented for repeatability through technology.
- Effective goal-setting—Sticking a flag in the ground as a target gives the organization something to rally around, providing managers and workers guidance on what constitutes success.
- Consistent monitoring of process and outcomes—Repetitive measurement establishes a history of performance over time—potentially in real time, if desired—and gives process owners feedback on what’s working and what’s not.
- Performance notification—If something is out of whack, proactively informing the metric owner(s) of the anomaly allows for action to be taken in time to have some effect. This can also cut down on the noise in the system by bringing problem areas to the attention of managers without them having to stumble on the processes that need it.
- Course correction—Whether slight adjustments are called for to tweak performance, or extensive changes in strategy are necessary to achieve overall performance goals, feedback from the measurement system gives managers the necessary input to make that call and change/adjust business activities.