Defining KPIs That Are Optimal For A Manufacturing Business
 Defining effective Key Performance Indicators (or KPIs) that are optimal for a manufacturing business doesn’t have to be difficult so long as you realize what information will and won’t help you determine how your company is meeting its goals and objectives, and that you understand the interdependencies of KPIs on each other in meeting those goals.
In the preliminary stage, many of our customers hold regular meetings of key stakeholders representing all core business areas to discuss, fine tune and ultimately come to a consensus on those KPIs that make most sense for managing the business’ overall health. As mentioned in my previous blog, “KPIS: The Basics & Why Non-Financial Metrics Matter,” the alignment of KPIs with organizational strategies and goals is the key to realizing bottom-line impact. The challenge is to incorporate metrics that provide a realistic and balanced view of the business.
Below is a representative selection of the metrics that our clients in the manufacturing sector have found most valuable in their KPI strategy.
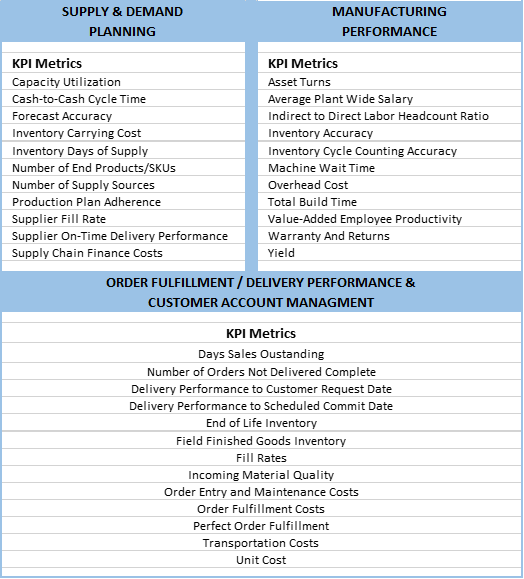
Keep in mind that the KPIs you define should not consist of a single metric like any of those above, but as a balanced scorecard of metrics that incorporate several different perspectives and cascade from the corporate level all the way down to individual plants or warehouses. These perspectives include business dimensions like customer, financial and process-related views of the business, along with measurement factors like cost, productivity and quality.
KPI PERSPECTIVES
- Customer-oriented views measure the ability of an organization to provide quality goods and services that meet customer expectations, such as retention, profitability, satisfaction and loyalty.
- Financial views measure the economic impact of actions on growth, profitability and risk from shareholder’s perspective, such as net income, ROI, ROA, cash flow.
- And internal process (or operational) views measure the business processes that create customer and shareholder satisfaction (such as Total Quality Management, Six Sigma and Lean).
Although the focus of each view is distinctly different, there is a common thread between them that drives business performance.
KPI MEASUREMENT FACTORS
Another important consideration is the selection of appropriate measurements to capture operational performance over time and then relate the KPIs to internal business and external industry benchmarks. The following chart reflects common measurement groupings employed by several of the manufacturing organizations with whom we work.

How KPIs Cascade
Now let’s look at how KPIs can filter down through a business that is focused on revenue growth and profits. In this instance, the two financial KPIs of revenue growth and profits could cascade down through KPIs to the operational level and tie into metrics that may include weekly customer shipments, perfect order fill rates, backlog metrics, and accounts receivable. At the regional level, the KPIs may focus more on how they tie in with the overall plan, and not so much on the customer or product level.
That means a regional executive with responsibility for multiple plants would want to look at the key elements of what makes each plant operate efficiently. A KPI may be designed to look at on-time fill rates or the plant’s capacity compared to backlog.
For a corporate executive, KPIs would then leverage the regional data into performance metrics that tie everything together from a revenue and expense perspective. This method provides a significant advantage over the traditional, historical-view approach. Consider that typically, by the time a company sees something wrong with some key financial metrics, it is too late to do anything about it because the money has either been spent already or the product has already been sold. Examining the financials once the quarter is closed may tell them that they missed their numbers because they had a backlog, but didn’t have the product to ship. Unfortunately, though, they can’t change what has happened after the fact.
The Importance of Operational KPIs
Where companies do start having an impact through KPIs is more on the operational side, where they can see problems coming up through the supply chain and make necessary adjustments “on the fly” – either at the corporate, regional or ground level. Take that same example. Instead of waiting for the quarter to end to find out what happened, the KPI (typically delivered via a dashboard) would enable the company to examine their order fill rates daily to determine what is happening either by different product lines or key accounts.
For example, a sales manager using an executive dashboard can better determine if there’s a likelihood that the order fill rates for a big box discount retailer like Wal-Mart will be missed, resulting in his company getting hit with compliance fees. Likewise, a logistics manager may determine through his KPIs that his team isn’t hitting their order fill rates because there’s a problem with a specific packaging machine. Both managers can quickly take corrective action to remedy the situation before the order fill rate (and company’s profit) is adversely affected.
In my next post, I’ll discuss the components of an effective KPI system and some best practices in delivering KPIs to key stakeholders from the executive office down to the individual plant level.