Supply Chain Performance is closer to the bottom line than you think
 Managing the Supply Chain dynamics that exist in many companies is not just about improving operational efficiency. When we look below the surface, we see a complex picture that ties operational efficiency to customer service and overall company profitability. That’s no surprise to any Supply Chain executive, but what is a surprise is the relative magnitude of the interrelationships. Consider the relationship between the following list of key items:
- Product item level profit margin
- Customer service level – probability of filling an order line item
- Demand forecast accuracy
- Inventory replenishment lead time and consistency
- Inventory carrying cost
- Inventory level and mix
The relationship between inventory, forecast accuracy and lead time is well understood. However, the relationship between inventory lead time variability is less clear. Added to those operational variables is the inventory carrying cost that has been inflated due to operational dynamics like demand forecasting and inventory replenishment, which impact overhead cost. In many cases, overhead components such as inventory carrying cost are simply allocated based on unit cost, not on the actual inventory value of each product. So what’s the problem with this approach? Nothing if you want unprofitable products to be disguised and supported by your cash cows! Here’s an example of the magnitude of impact on product A490.
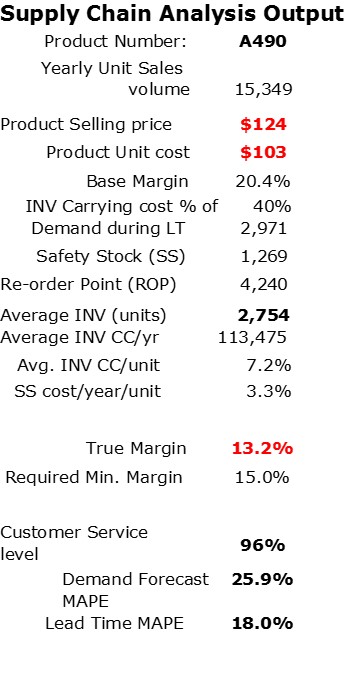 If you assume only a portion of the overhead is already in the product unit cost, we see the expected margin is 20.4%. But if we add in the specific burden of 7.2% for inventory required to support product A490 at a relatively low customer service level of 96%, the true margin drops to 13.2% — below our minimum target of 15%.
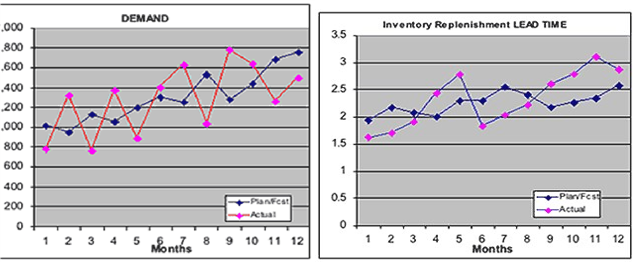
So what’s driving the problem? Notice the demand forecasting and inventory replenishment graphs below. That type of Supply Chain performance produces an unacceptable product margin. The alternatives are to improve forecasting and inventory replenishment, continue to reduce customer delivery performance, or raise the price of the product.
The point of this analysis is to single out the not so obvious products that are pulling down profitability and make changes where appropriate. This challenge is not just a once per year task for the accounting people, it’s a monthly real time tracking and management task supported by tools like Silvon Stratum.