What’s Your Dashboard “Type?”
 To stay competitive, organizations need Business Intelligence (or accurate, actionable information about key business metrics). Performance dashboards come into play next by serving up summaries and reports of the BI that’s most critical to the organization.
An effective dashboard combines information dynamically and in new ways beyond traditional paper reports to measure performance and enable fast, appropriate action by decision makers. Even more, dashboards deliver significant value by leveraging Key Performance Indicators (or KPIs) to manage progress towards goals.
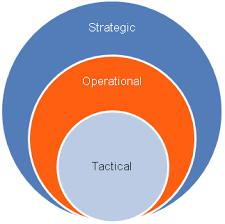
There are three general “flavors” of performance dashboards, each differing in the level of detail they offer and the analytics they provide .
The Operational Dashboard
The most common type of dashboard is the operational dashboard. For manufacturers, these dashboards are usually deployed at the departmental level to monitor the performance of manufacturing-related processes. For example, an operational dashboard might track the number of complaints, defects or returns related to each product manufactured by an organization.
Typically, operational dashboards should provide a lot of detailed data without requiring users to find the information they need via “drill down” capabilities. This is because front-line employees generally don’t have the time or expertise to analyze and determine the additional information they may need in order to solve a problem.
The Tactical Dashboard
The second type of dashboard is a tactical dashboard which monitors the processes that support an organization’s strategic initiatives. A tactical dashboard not only sits between strategic and operational dashboards; it differs in the level of detail at which data is presented to users. For example, a tactical dashboard that tracks actual vs. target market share in various countries may be deployed by an organization that wants to grow worldwide market share by XX percent in a year. That same company’s operational dashboard, on the other hand, may track at various times of the year specific product sales vs. sales of similar competitive products.
The Strategic Dashboard
The third dashboard type, a strategic dashboard, measures progress towards strategic corporate goals. These dashboards often include non-financial KPIs such as customer satisfaction, customer attrition or market share, as well as comparisons like this year’s fourth quarter sales vs. the same quarter in prior years. They also can include financial KPIs like profitability and lifetime value per customer.
A strategic dashboard presents highly summarized global trends for top management. Since it’s high-level in nature, it needs to provide greater abilities for users to drill into the underlying detail. In addition to highlighting internal operational and tactical trends, a strategic dashboard is more likely to include data on global, external trends related to regulations, currency fluctuations, market share or projected competitive profit margins. The strategic dashboard may also include information about external events that can have an impact on the business’s strategic goals.
While this presents a very high-level look at the types of dashboards used by businesses today, numerous posts that dive deeper into specific topics surrounding the creation and use of Dashboards are available for your reading pleasure. Feel free to take a look when you have some time … a selection of these posts have been highlighted below for you!
Dashboards give executives the green light for business visibility
Is that dashboard really a dashboard?
Dashboards: Linking key metrics across the enterprise
Dashboard design: 5 pitfalls to avoid