Business Intelligence: Think Outside the Box When It Comes To Your Data
 Almost any company that has a business intelligence application uses that application to analyze SALES data. But what other kind of information can people analyze with a reporting system?
Many of our customers use our business intelligence app to report on many different types of data, some of it in context with data like SALES; and some of it on its own.
Some examples of information that we often see our manufacturing and distribution clients analyze in context with their sales data is:
- POS from major retailers – so they can pinpoint sell thru down to the store level
- Inventory – helping them ensure that product is available to ship for customer orders
- Distributor sales – enabling them to check sell in and sell thru from major distributors or dealers
- Sales plans – either created from their data in our reporting solution or imported from Excel so they can analyze actual performance against them.
Other types of information that can be assessed by a business reporting solution include purchasing data, inventory information, manufacturing-related data, planning and forecasting info. and more like the following:
- Customer service tickets – including counts, time to close and reason codes. We actually use our business intelligence application to track our own customer support tickets here!)
- Purchase Orders – both open POs and historic receipts to better assess who are suppliers are and how much we spend with them, among other things
- Accounts Receivable – both open and collected – to see how much any customer may owe, what’s outstanding and whether they pay on time or not
- Plant and machine stats – including whether a line is hitting its target production rate, good vs bad production stats, shift performance analysis, etc.
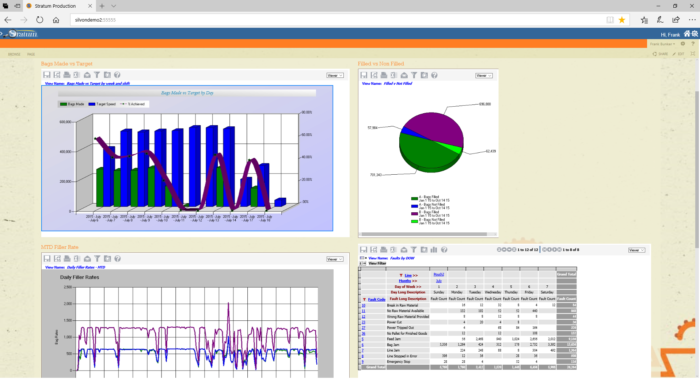
The following screenshot depicts a Manufacturing dashboard. The dashboard shows Daily production for a line vs Target and % Achievement – with the underlying data going down to the shift level. Also shown are fill rates for a bagging line captured in 5-minute increments. The pie chart highlights good and damaged bags from two different lines in a work center. And the grid shows fault rates and reason codes by day of the week.
Think outside the box when it comes to the data you analyze for your business!
Since Silvon’s business intelligence application is designed for manufacturing and distribution companies, these are just some data types that fit in the traditional categories of our product. But just about any data beyond SALES data can wind up in your reporting application. As a matter of fact, we regularly track phone calls made by our sales and support teams based on our phone switch data. And we leverage our analytics to see how often our help videos are viewed.
Let your mind wander. Surely, you can come up with some additional data that you’d like to analyze at your company, too. All it takes is a little thinking outside the box!